What it does
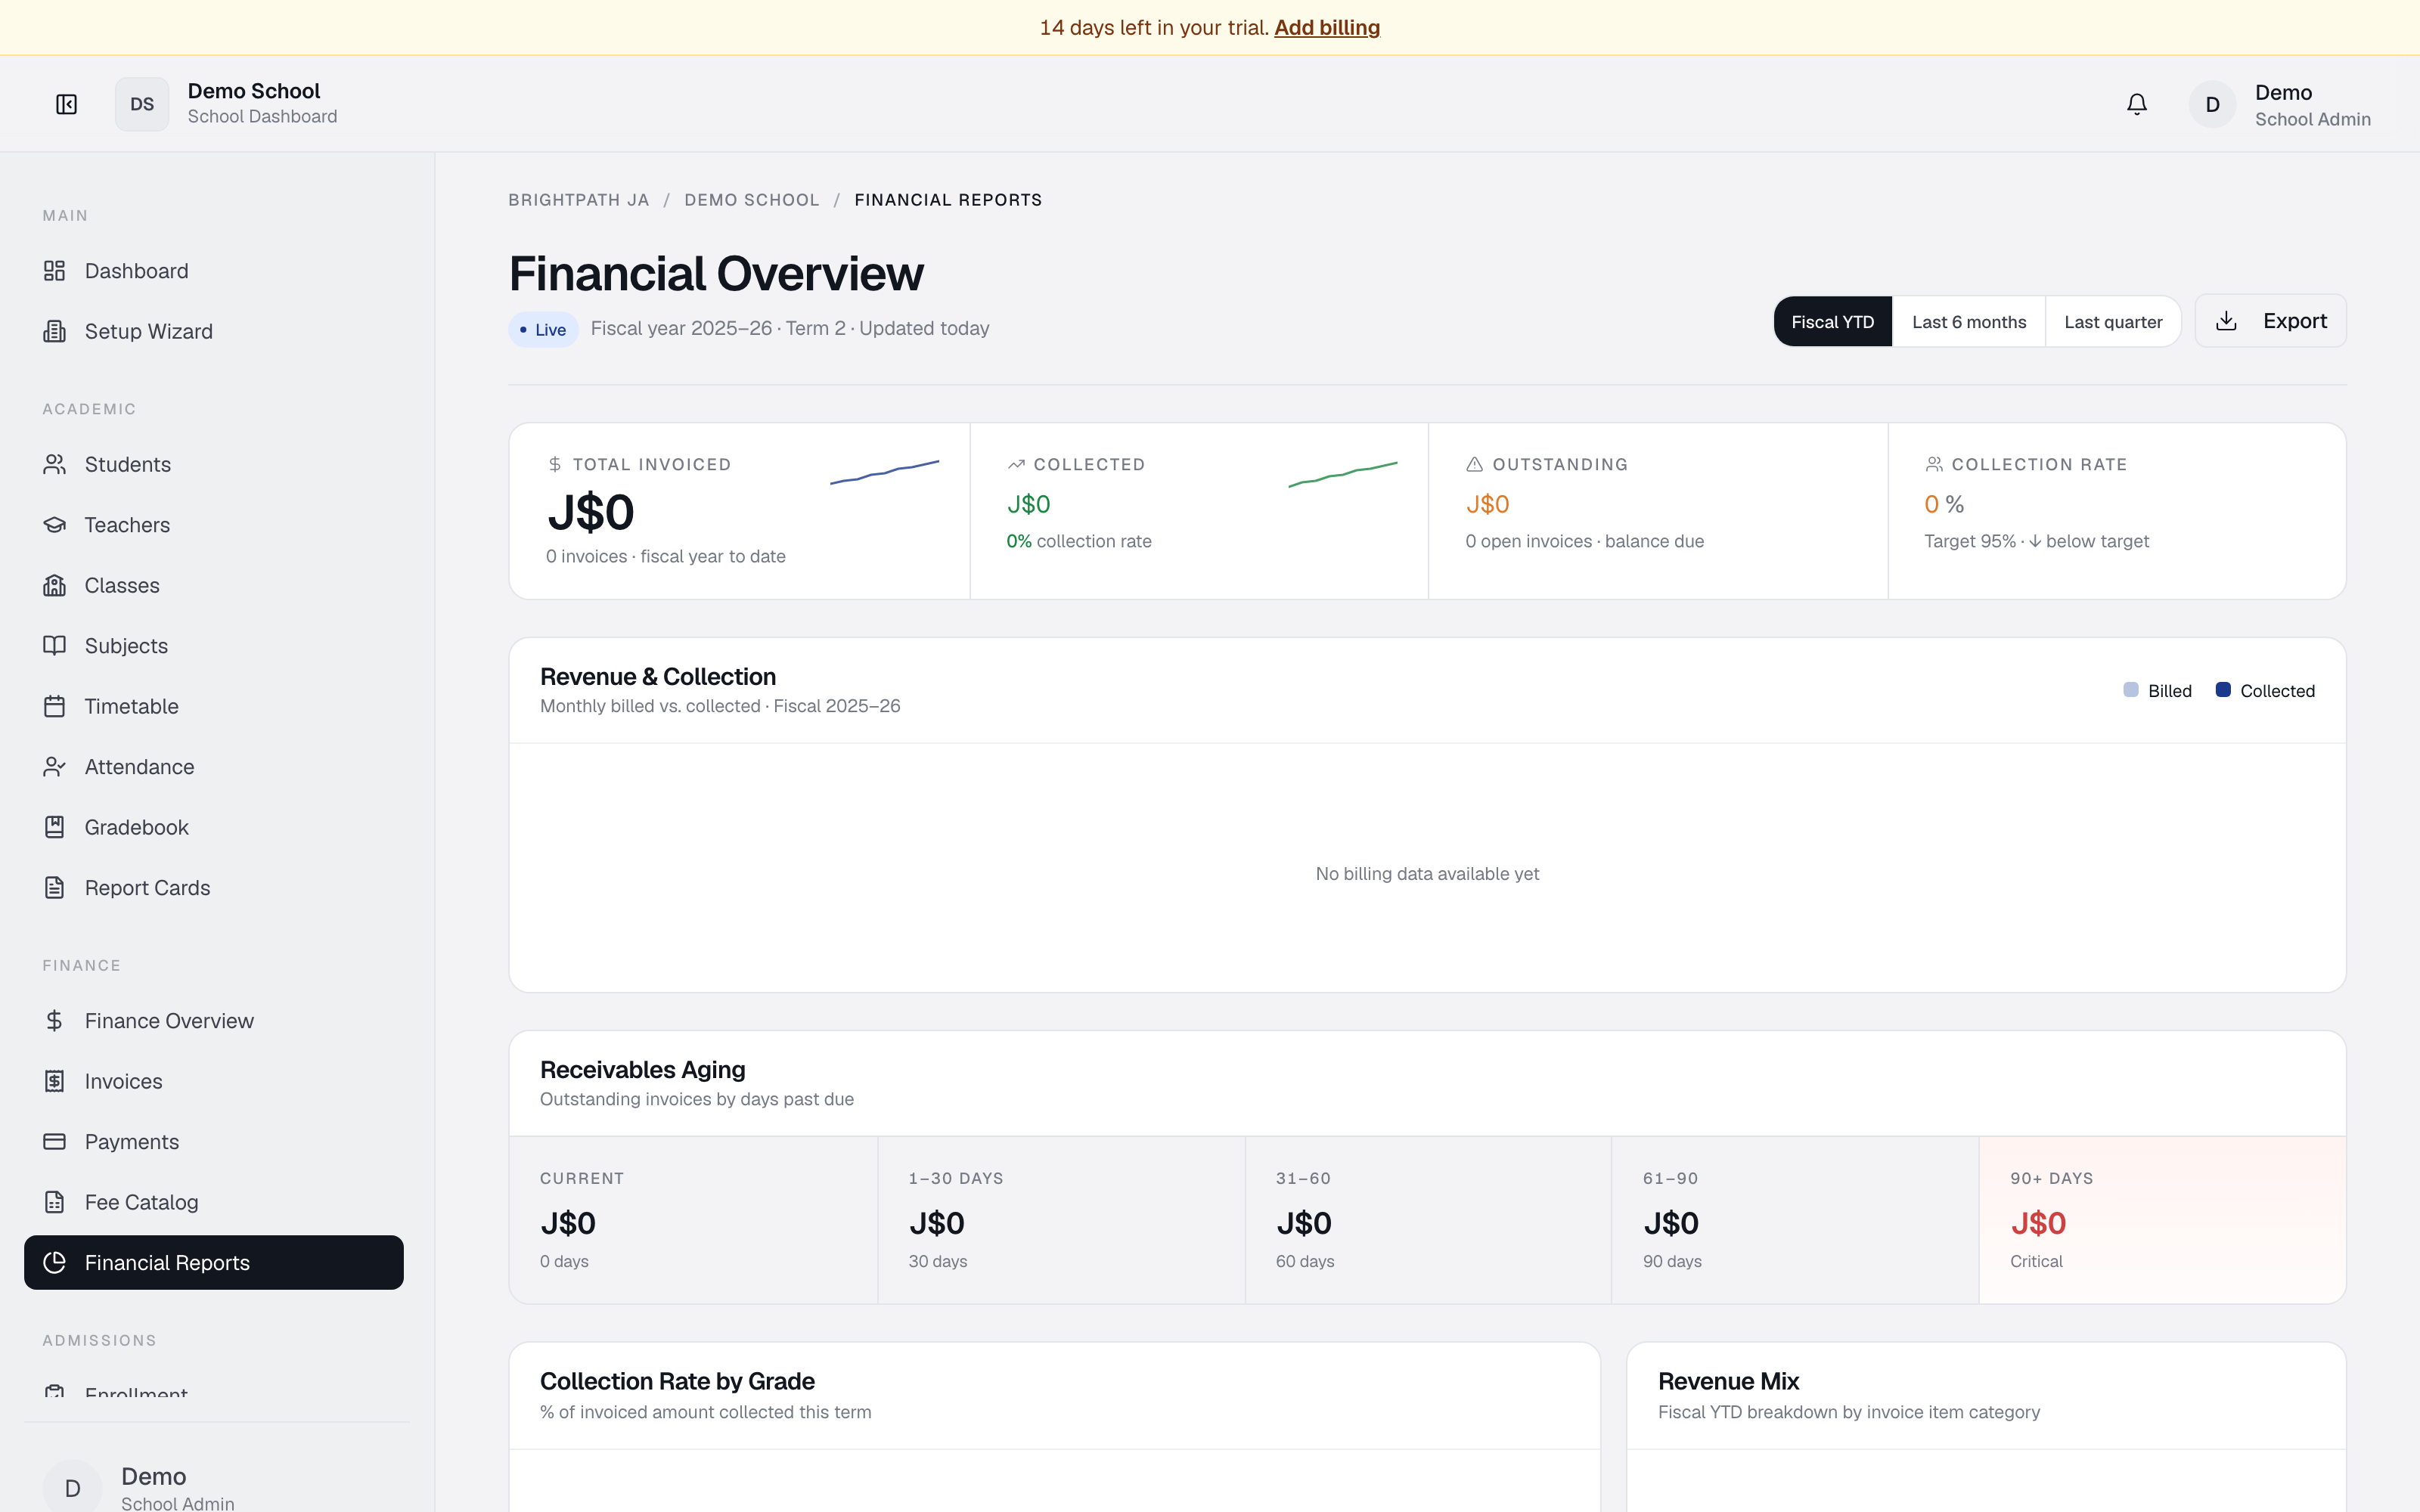
Financial Reports provides detailed analytics on your school's billing performance. It displays live KPIs, monthly revenue vs. collection charts, receivables aging, collection rates by grade, revenue mix by category, and recent transaction logs. Data is grouped by fiscal year, with views for year-to-date, last 6 months, or last quarter.
Who uses it
- Bursar — primary user. Reviews collections, aging, and follows up on delinquent accounts.
- Principal / School Admin — monitors school financial health and collection performance.
- Auditor — verifies billing summaries, reconciliation, and aging.
Common tasks
Check financial health
Four KPI cards at the top: Total invoiced, Collected (+ collection rate %), Outstanding, Collection rate (green ≥90%, yellow <90%).
View monthly revenue vs collection
The Revenue & Collection chart shows two bars per month: Billed (grey, total invoiced) and Collected (accent, total received). Gaps signal cash-flow delays.
Use the Fiscal YTD, Last 6 months, or Last quarter buttons to change the range.
Analyze receivables aging
Receivables Aging has five columns: Current (not yet due), 1–30, 31–60, 61–90, and 90+ days (red — critical). High 90+ amounts warrant immediate action.
Check collection rate by grade
Collection Rate by Grade shows each grade level with a collection bar (red low, yellow medium, green high) and the rate %. Grades below 90% may need follow-up.
Understand revenue mix
The Revenue Mix donut chart breaks invoiced amounts by category: Tuition, Activity fees, Transport, Canteen, Other. The legend shows each category's amount and percentage.
Review recent transactions
Recent Transactions shows the latest 8 payments — student, method (e.g. manual_payment, powertanz_card), JMD amount, date, status (Paid / Pending / Overdue), invoice reference. Click View all for the full payment history.
Export
Click Export in the top right to download a PDF or spreadsheet snapshot of the current dashboard.
Troubleshooting
- Collection rate 0% — no successful payments recorded yet.
- Revenue mix shows no data — invoices need line items with descriptions or linked fee items to be categorized.
- High 90+ aging amount — overdue invoices. Follow up via Invoices or Payments.
- Data looks stale — refresh the page; charts update on load.
- Grade missing from Collection by Grade — only grades with at least one invoice appear.
Limits & known issues
- Charts refresh on page load; no auto-refresh during the session.
- Aging uses the due date — invoices without one may not categorize correctly.
- Revenue categorization is inferred from fee item / invoice item names; misnamed items appear in "Other".
- Export format is basic; no custom report builder yet.