What it does
Analytics provides interactive dashboards across three areas:
- Academic Insights — subject and grade-level averages.
- Attendance Trends — daily presence, lateness, and absences over time.
- Financial Health — monthly collections, transaction counts, trends.
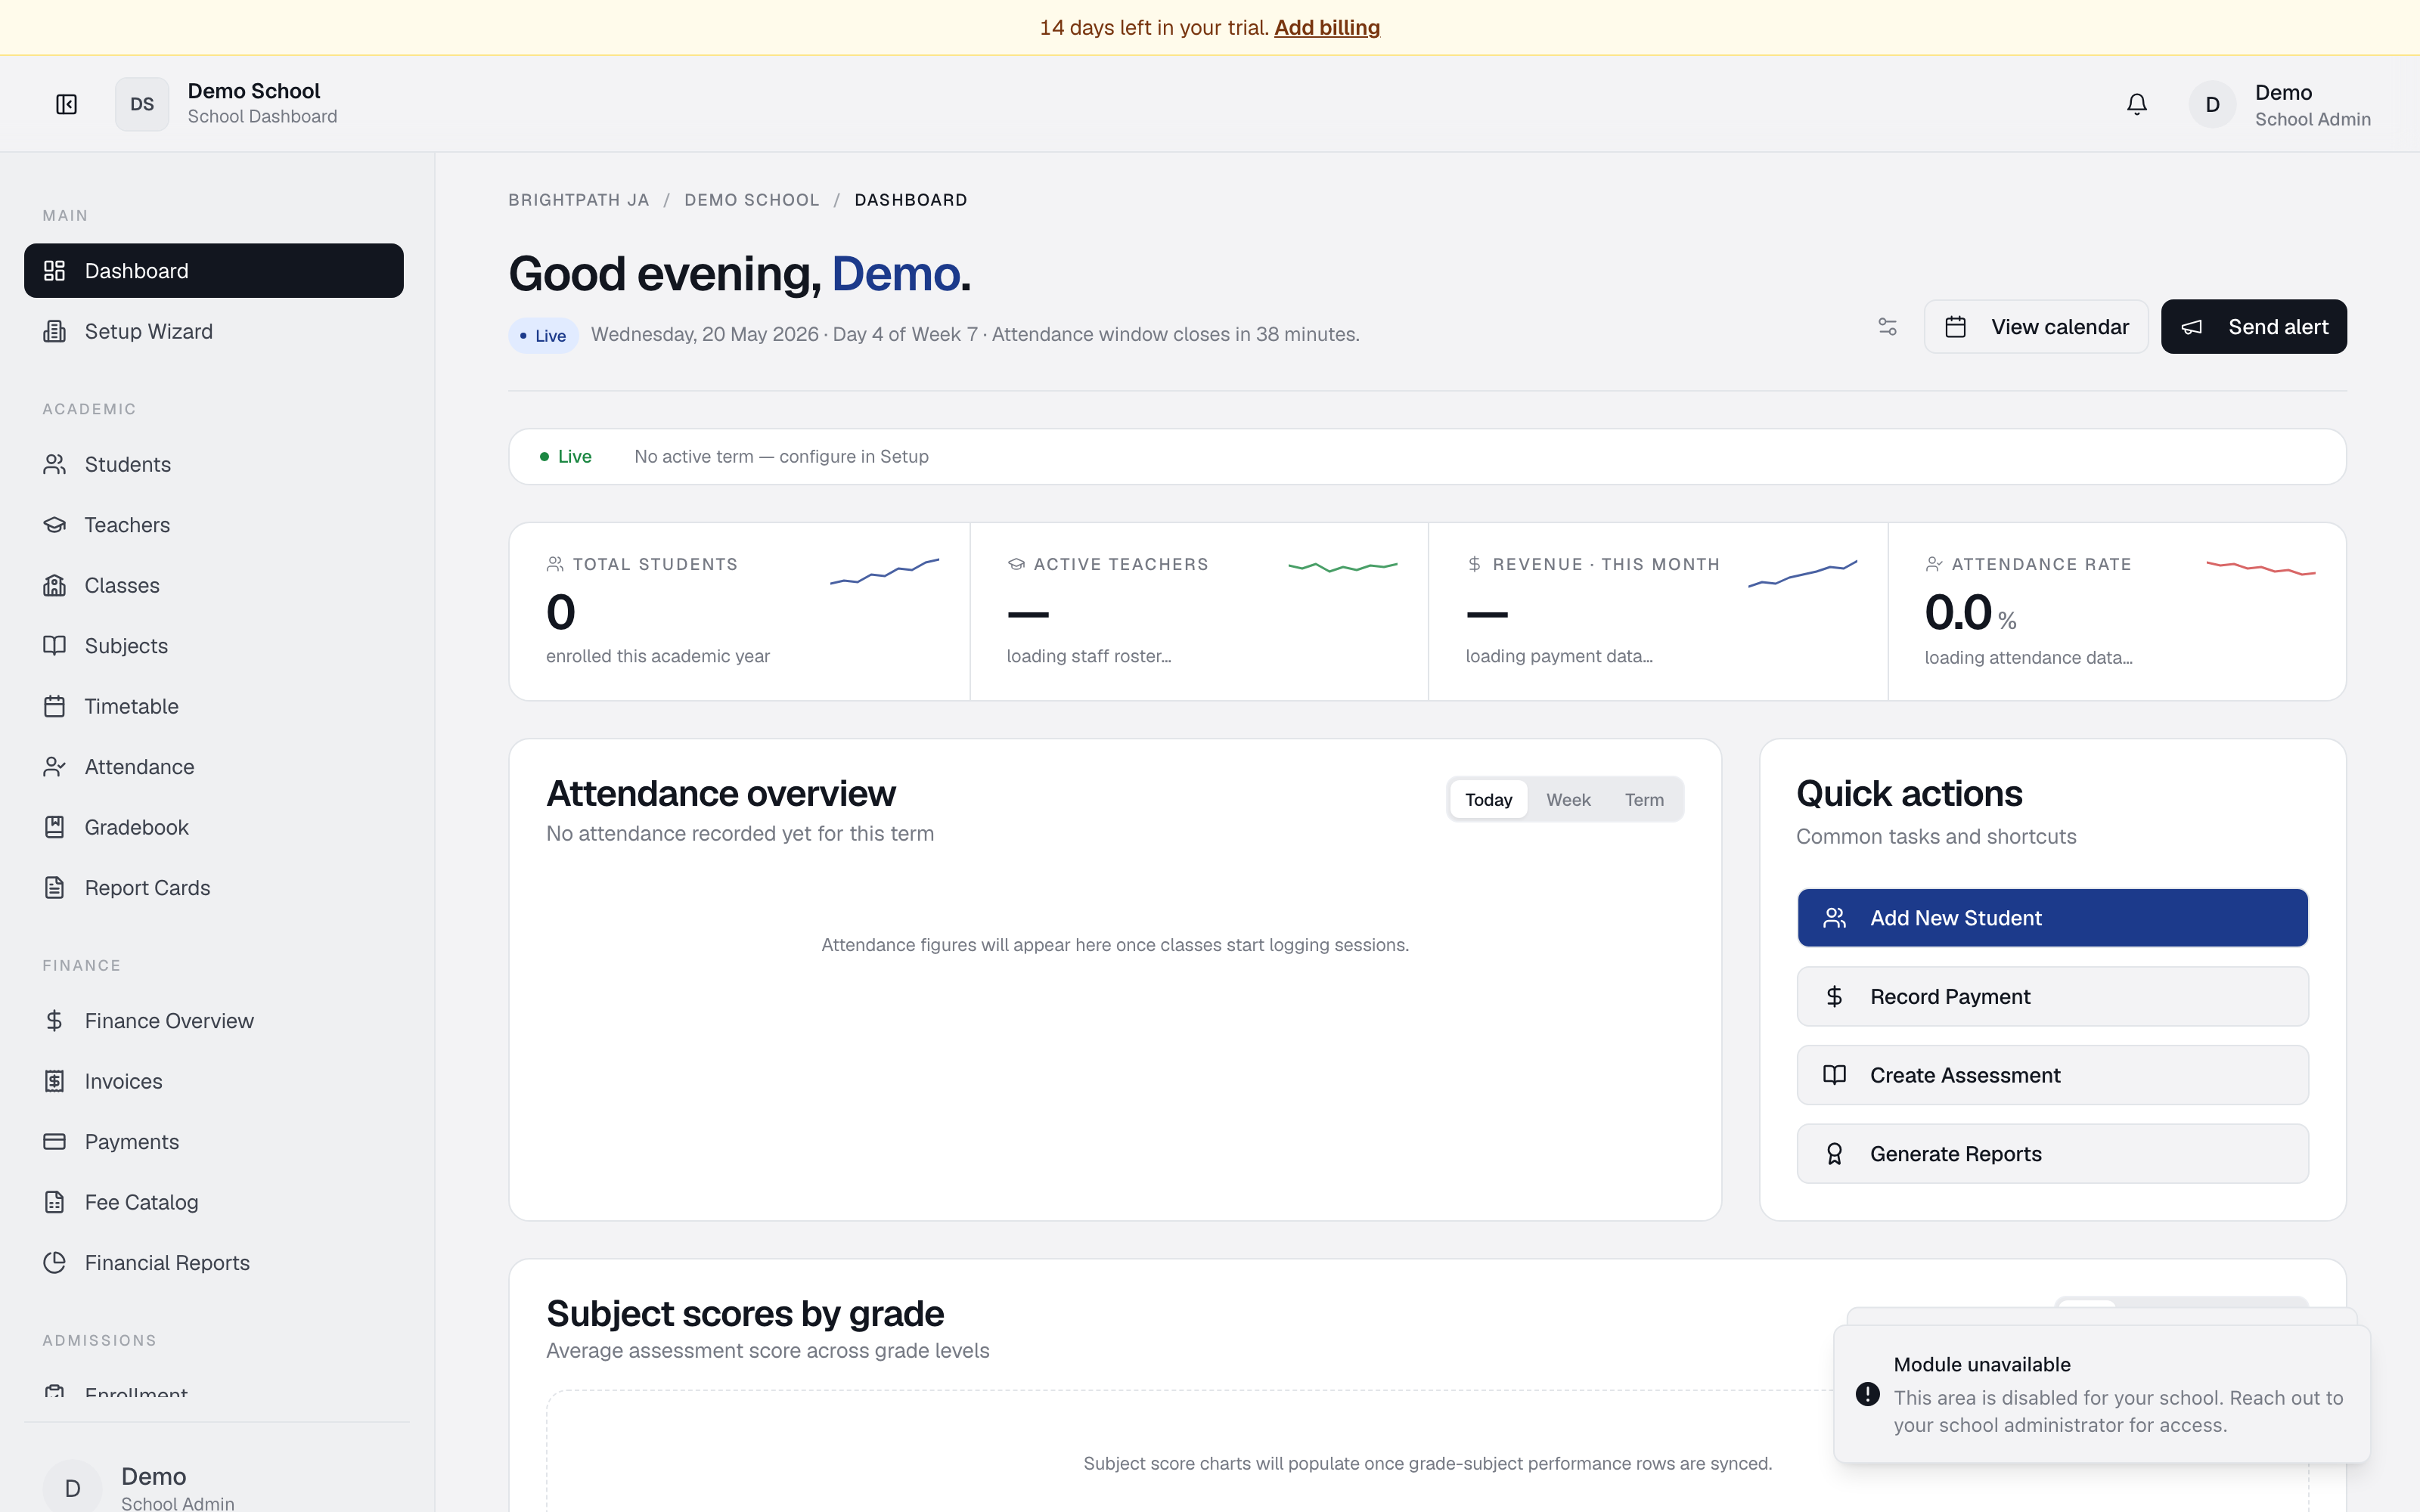
Four overview cards at the top: Total Students, Attendance Rate, Average Grade, Revenue Collected.
Who uses it
- Principal / School Admin — overview of school health.
- Bursar — financial trends.
- Registrar — attendance trends and academic performance.
Common tasks
View academic performance
Click Academic Insights. The Subject Performance Comparison chart shows top five subjects by average. A table below lists all grades.
Check attendance and punctuality
Click Attendance Trends. The Attendance Trendline shows daily present, absent, late, excused. The summary text gives overall attendance and punctuality rates.
Monitor revenue collections
Click Financial Health. The Collections Over Time chart shows monthly payment totals. Badges show latest month total and transaction count.
Change the timeframe
Use the Timeframe dropdown (top right) — last 30 days, 90 days, or Academic Year to Date.
Export the dashboard
Click Export Dashboard for a CSV of all metrics — useful for board reports.
Read key insights
Scroll to Highlights & Actions — three summary cards suggest actions based on data (e.g. "Attendance is tracking below baseline — focus on punctuality reminders").
Troubleshooting
- Chart is empty — no data for the period. Record grades, attendance, or payments first.
- Timeframe filter has no effect — refresh the page.
- Numbers look incorrect — verify data has been submitted in Gradebook, Attendance, or Payments.
Limits & known issues
- Charts are not live — refresh to update.
- Custom date ranges are not supported.
- Only successful payments are in collections charts (pending/cancelled excluded).
- For per-grade cohort comparison, use the Performance module.